
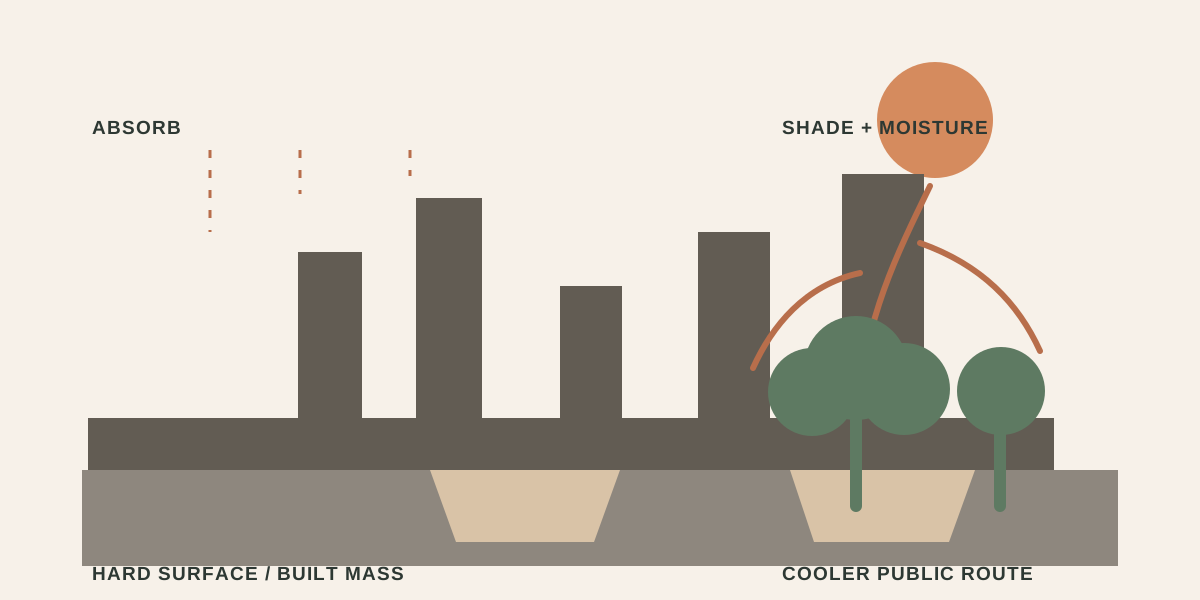
An urban heat island is a built-up area that becomes warmer than its less-developed surroundings. For architecture, the useful question is not only “how many degrees?” It is which surfaces retain heat, where shade and moisture are present, how wind is interrupted, and whether people can reach a cooler public route. Shade design is therefore not the isolated placement of a canopy or tree; it is a reading of surfaces, vegetation, water, geometry and use together.
A heat island is not only air temperature
The U.S. Environmental Protection Agency (EPA) distinguishes two scales of heat island: a surface heat island, associated with heated roofs and ground surfaces, and an atmospheric heat island, associated with warmer urban air. They do not appear in the same way on the same map. Reading a thermal image as a complete account of human comfort can therefore be misleading.
Start an observation by keeping these distinctions visible:
- Surface: how are asphalt, concrete, roofs, stone, soil, vegetation and water receiving or releasing energy?
- Air: where do building height, spacing and street direction slow air movement?
- Use: where do people walk, wait, sit and return at different times of day?
The EPA’s overview of heat islands treats the loss of natural landscapes, hard-surface properties, urban geometry and anthropogenic heat as separate factors. This framework resists the easy promise that one material can solve the whole problem.
Draw shade as continuity, not as an object
The shade of a tree or pergola changes conditions at its immediate location. Everyday public life, however, needs a connected sequence between entering, walking, waiting and resting. Draw shade as a route that moves through the day rather than as an isolated object on a plan.
Ask four questions:
- Is there a shaded transition from the entrance to a place to sit?
- Does the shade help only at noon, or also during morning and evening use?
- Does it offer somewhere to pause, access to water and a meaningful view?
- Will the route still work as planting grows and maintenance continues?
These questions are not a promise of a specific temperature reduction. Local measurements, climate data and maintenance conditions are needed before claiming an effect. The purpose is to make visible which evidence a design decision would need to be tested against.
Urban geometry affects wind and heat together
The EPA notes that the dimensions and spacing of buildings influence air flow and the way urban surfaces absorb and release solar energy. Narrow streets and taller buildings can form urban canyons that restrict cooling air movement. This does not support a one-way rule such as “taller is always hotter” or “narrower is always cooler”. Orientation, materials, sky exposure, wind, planting and use have to be read together.
Record the same section in a field drawing:
- surfaces of buildings in sun and shade,
- the visible relation between street width and building height,
- edges that block or redirect wind,
- planting in leaf and bare seasons,
- places where people stop, wait or avoid stopping.
These records can build a valuable design archive without pretending to be a complete heat map. The field note on Space Syntax and invisible connections offers a complementary way to think about how heat and shade might be distributed along a route, through its attention to networks and accessibility.
Six steps for reading shade and public space
1. Fix the time, then change it
Instead of photographing a place at one hour, make simple plan and section records in the morning, at noon and in the evening. Do not invent a measurement; mark where and when shade is observed.
2. Keep surfaces distinct
The surface temperature of asphalt is not the same data as the air beside it. Observe hard ground, exposed soil, planted shade and water edges separately. The EPA reduction guide discusses reflectance, thermal emissivity and heat capacity as related surface properties.
3. Match shade to use
Do not leave shade as a graphic covering an empty area. Draw the thresholds needed for walking, waiting, playing, taking a short break or resting. The same shaded area will not produce the same experience for every user.
4. Think planting and water with maintenance
Treating plants as visual symbols of cooling hides the questions of irrigation and care. Water sources, root space, season, safe access and local maintenance capacity belong to the design decision. This entry does not prescribe a species or irrigation quantity without local evidence.
5. Test route continuity
If a person must cross a long exposed surface between separate shaded patches, several good details may not form a coherent route. Connect entries, pauses, transitions and returns in one diagram. The courtyard and circulation of the Third Place project offer a useful comparison for reading a common centre as a sequence of thresholds rather than one image.
6. Do not settle the effect before measuring it
Writing that a proposal “cools the area by” a particular amount requires an appropriate measurement. Without the observation note, surface/air distinction, date and time, weather conditions and method, no numerical result should be claimed. The EPA’s heat-island reduction solutions present vegetation and green infrastructure as a family of approaches, not as a guarantee for every site.
Keep decision, evidence and limit in one table
| Design decision | Visible evidence | Open limit |
|---|---|---|
| Tree-lined shaded route | A daily shade diagram and section | Growth, irrigation and maintenance |
| More permeable ground | Surface and rainfall scenario | Local soil, drainage and accessibility |
| Canopy or shading element | Solar orientation, section and use route | Wind, structure and maintenance |
| Open or planted common space | User route, seating and planting relation | Safety, operation and seasonal change |
This is not a scoring system. It keeps the drawing that explains an idea beside the uncertainty that still needs research. A general adjective such as “climate-responsive” can then become a spatial proposal that can be tested.
Do not treat public space as a cool backdrop
Protection from heat should not reduce public space to a corridor people hurry through. Seating, encounter, play, waiting, accessibility and safety are part of the same spatial decision. Too much shade can also affect visibility, plant health or night-time safety; the aim is not to make a place as dark as possible, but to build an open space that supports different patterns of use through the day.
This perspective allows a return to the courtyard in the Third Place design notes. The courtyard gathers its programme around a shared threshold. A claim about microclimatic performance would still require measurement, but circulation, pause and sight lines can already be discussed in the first drawings. Public life and microclimate are different drawings on the same research table.
Conclusion: shade is shared infrastructure
An architectural response to the urban heat island is not one coating or one tree. It reads how surfaces retain heat, how geometry and wind alter air movement, which maintenance relations support planting and water, and where people pause throughout the day. Shade design makes those relations visible as a public route.
A good first drawing does not overstate its result. It says where heat is observed, where shade appears, who uses the route and which data is still missing. Local climate, field measurements and operational knowledge can then test the proposal again. Architecture begins to contribute at this point: by drawing climate not as a decorative label but as the spatial organisation of everyday life.
Sources
- What Are Heat Islands? — U.S. Environmental Protection Agency; causes, types and impacts of heat islands.
- Guide to Reducing Heat Islands — U.S. Environmental Protection Agency; surface properties and reduction strategies.
- Reduce Heat Islands — U.S. Environmental Protection Agency; green infrastructure and reduction approaches.